Rare Recruitment are leaders in diverse graduate recruitment. Their Contextual Recruitment System (CRS) allows for insightful, anonymous analysis of hundreds of thousands of candidate applications to leading graduate schemes.
For their latest report, I was commissioned to produce a series of striking visualisations to support their research into candidate disadvantage, diversity and performance.
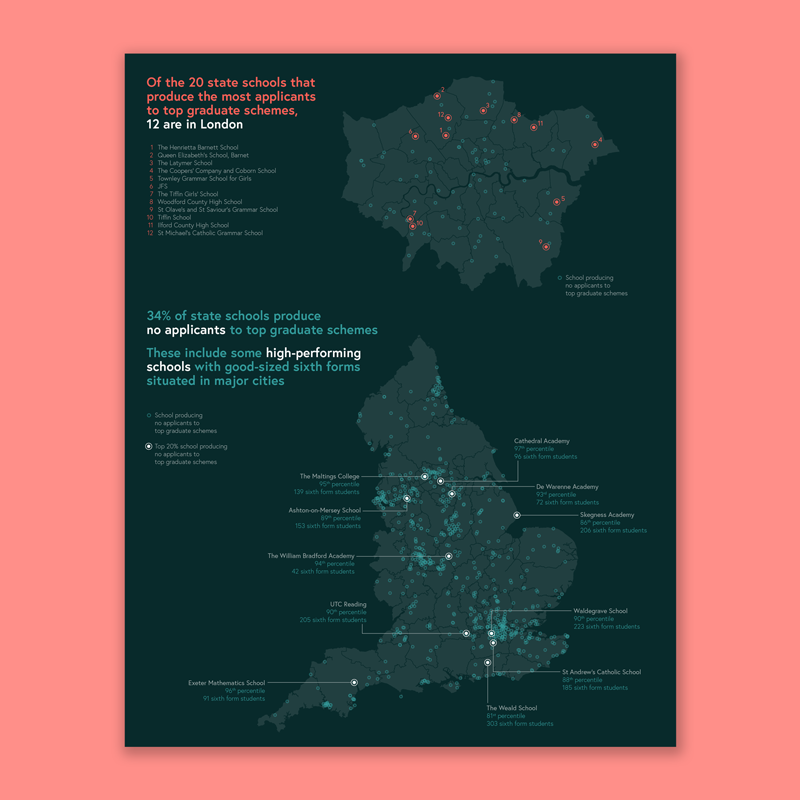
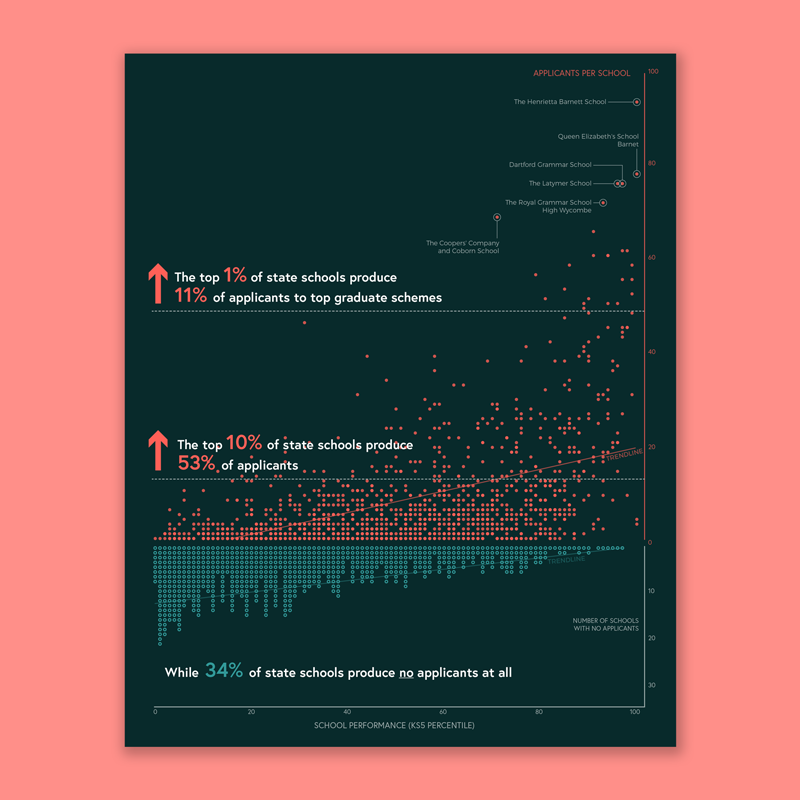
One of the key stories we wanted to tell was how applications to top graduate schemes from state school students were dominated by students that had attended a small percentage of state schools. These 'elite' schools were generally the highest-performing, with the top 10% of schools supplying over half of these applicants. At the same time, a third of all state schools - including high-performing schools - produced no applicants at all.
I worked closely with data analysts at Rare to come up with an effective way of displaying these findings. I used tools such as RAW and Excel to perform initial exploratory visualisations, using charts such as histograms, parallel sets and beeswarm plots. We eventually settled on a two-pronged approach. The schools that produced applicants were plotted as a scatter plot of performance against number of applicants, while the schools that produced no applicants were expanded downwards in a dot plot. This approach made clear the contrast between the elite schools and those that produced few or no applicants, while also allowing individual schools to be highlighted within the data.
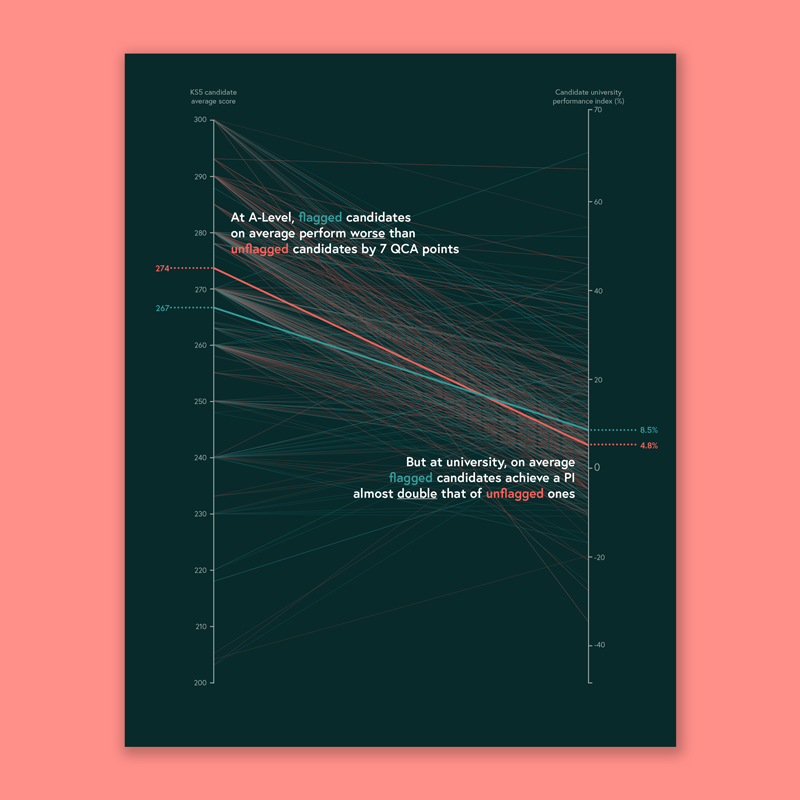
A second key finding was that candidates from disadvantaged backgrounds - although they performed worse on average at A-Level - tended to perform noticeably better than their non-disadvantaged peers at university.