Makeover Monday is a weekly opportunity for members of the data visualisation community to share and develop their data vis work. Participants are provided with an existing visualisation or dataset to explore and improve upon.
I've followed the #makeovermonday community for a little while but until now not taken part.
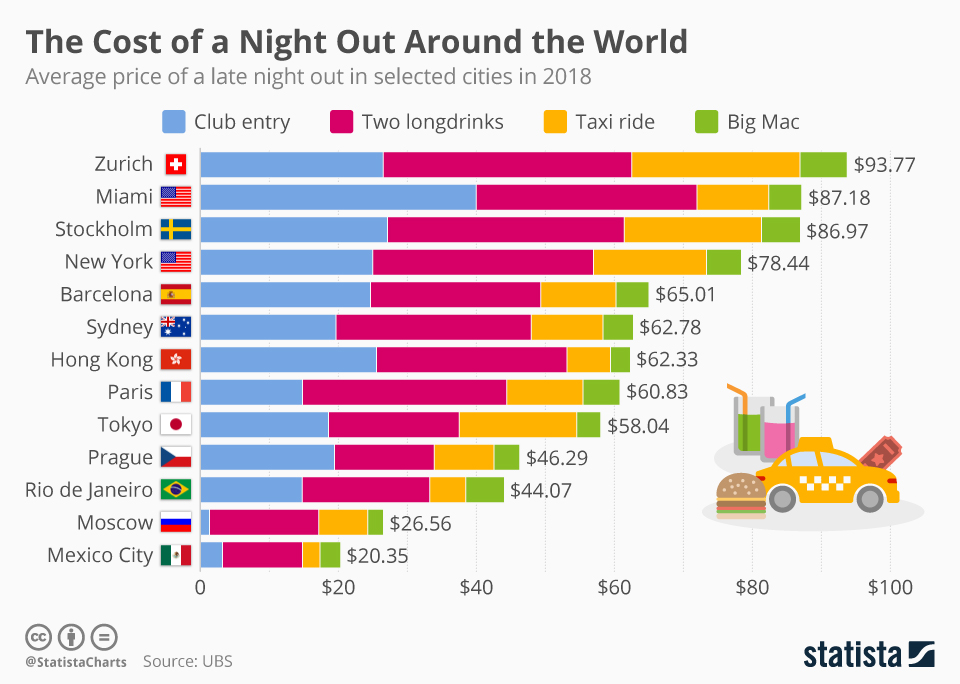
This week's graphic to makeover comes from Statista, with the original dataset from UBS. It explores the cost of a night out in various major cities around the world - a 'night out' being defined by UBS as a club entry, two long drinks, a taxi ride home and a Big Mac. Bad luck if you're more of a fan of cheesy chips.
Statista's visualisation of this dataset is a vibrantly-coloured stacked bar chart, festooned with country flags and graphics of burgers. It's not dire, but there's room for improvement.
I briefly considered a few different and 'jazzier' ways of presenting this data, including:
- Small multiples of bar charts by city, each chart with 4 bars for club entry, drinks, taxi and burger. Cute, but really we're not so interested in how the cost of a burger in Sydney compares with the cost of a taxi in Sydney. We're more interested in how the cost of burger in Sydney compares with the cost of a burger in Moscow.
- A heat map of costs for cities and items. Visually attractive, but then the column for burgers is basically all the same shade, since everything else is far more expensive. You could have independent colour scales for each item, but that'd likely be confusing.
- A map with small pull out bar or pie charts for each city. Sure, it's geographic data, but we're only dealing with a dozen points on a world map and frankly what benefit does the map add?
However, at the end of the day it's a pretty straightforward dataset, and I quickly returned to a bar chart format as the simplest and most effective way of presenting the numbers.
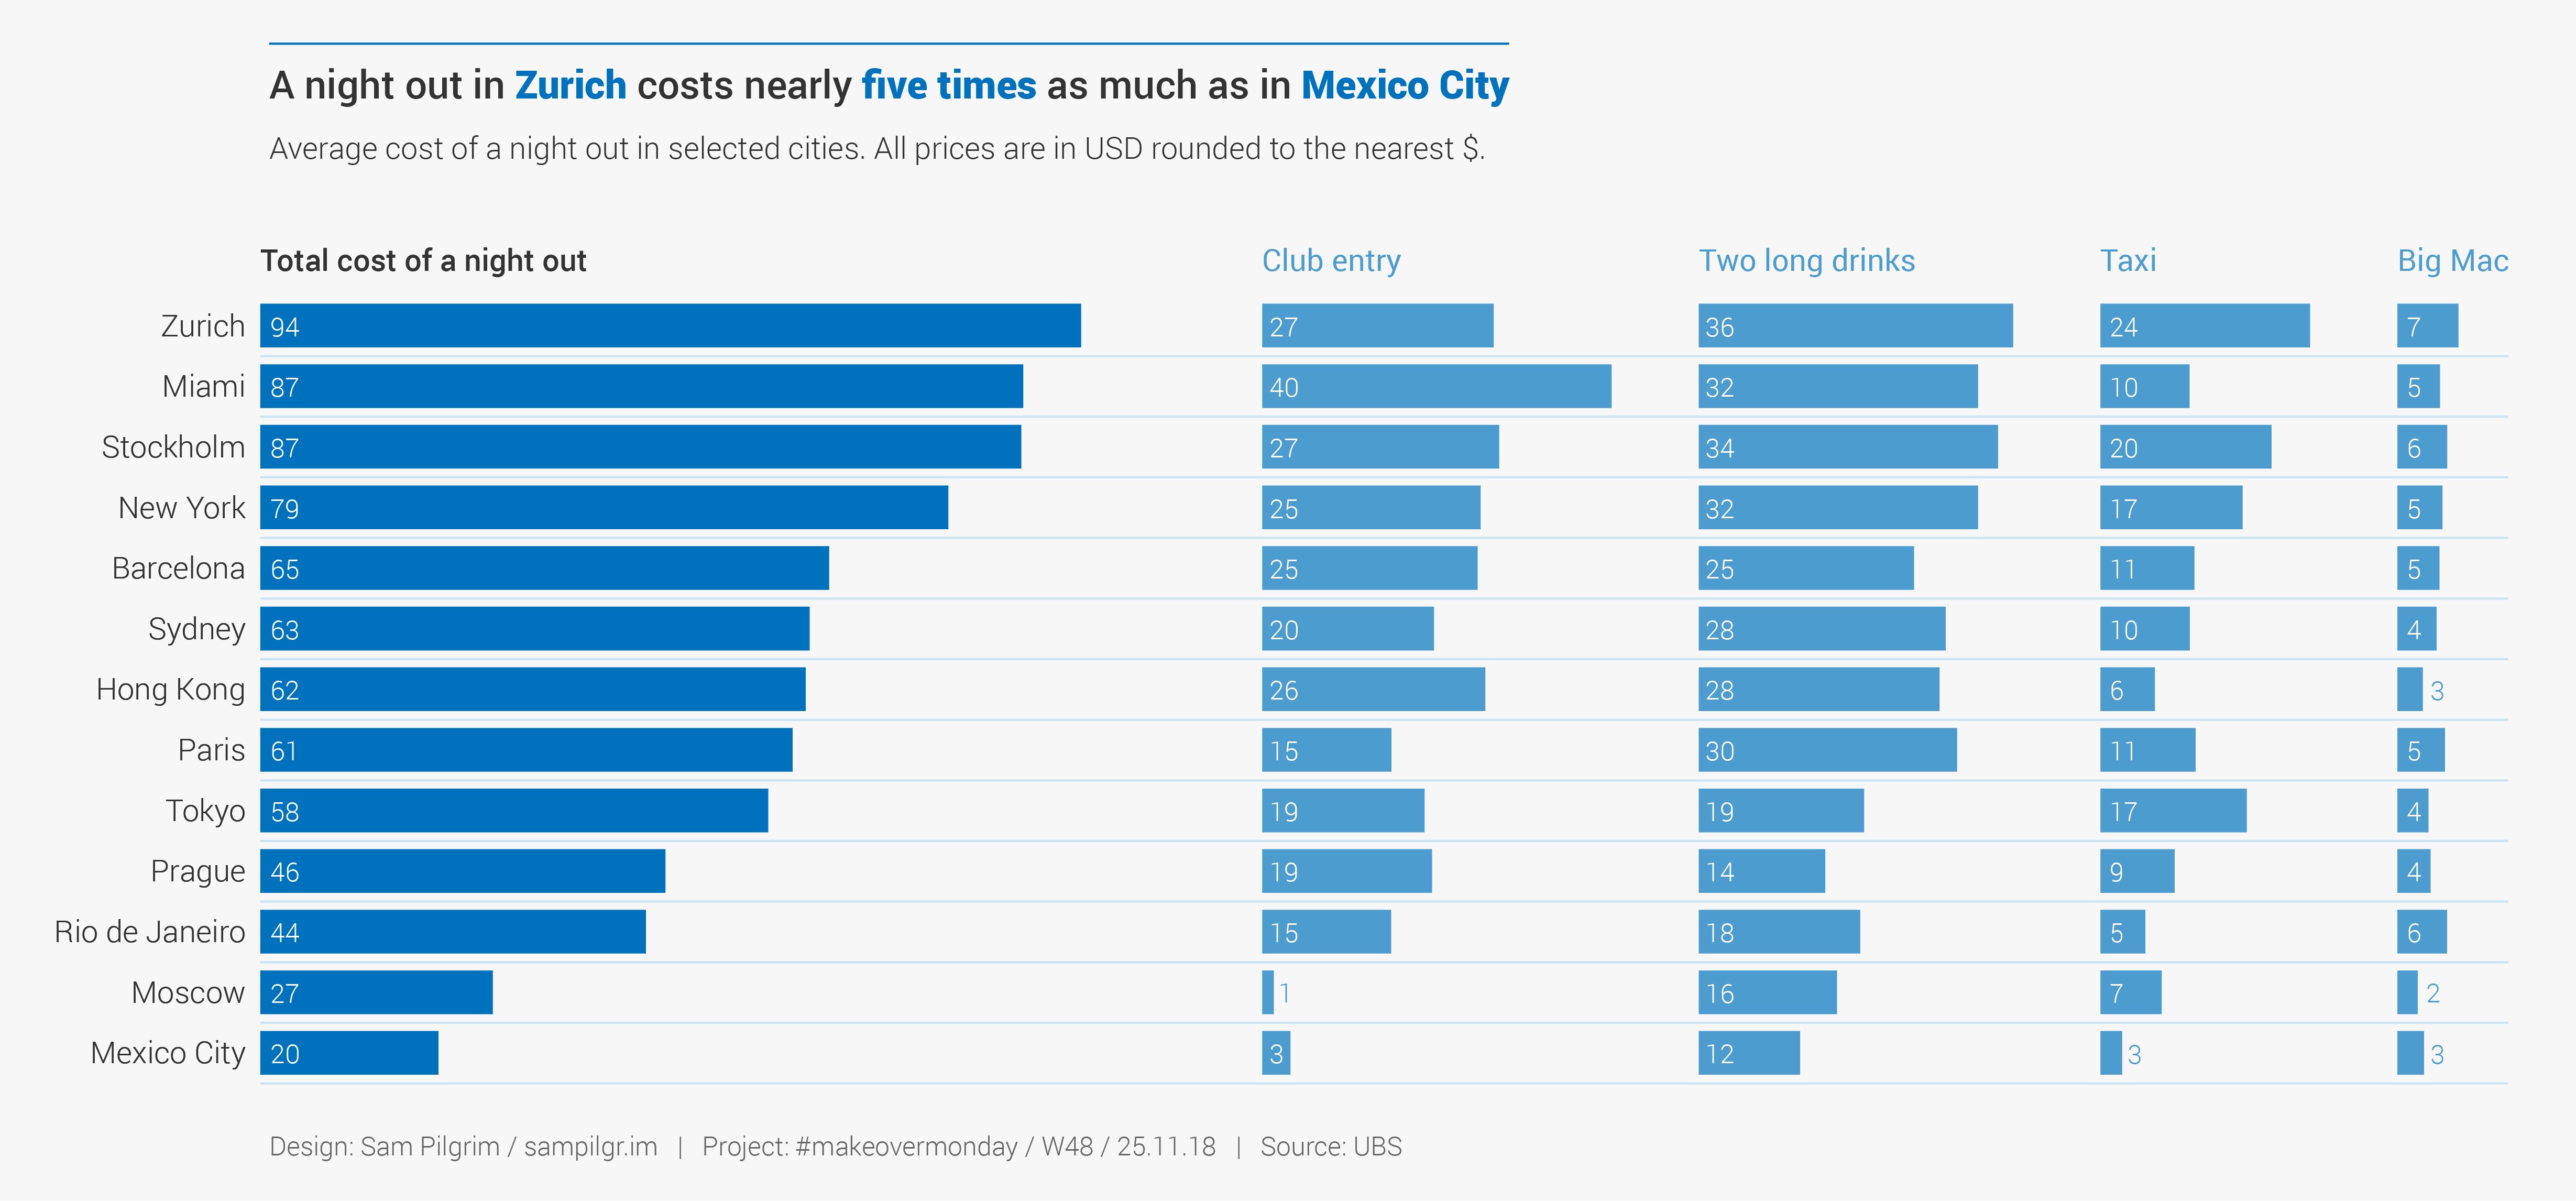
First thing first, I wanted to split the stacked bars out into individual bar charts. Stacked bars give a good overall picture of a part-to-whole dataset, but don't let you easily compare individual segments. I added a fifth bar chart of the totals, to retain the ability to compare total costs across cities.
There was no need to duplicate city labels - a single set of labels aligned with all charts, with faint rules to guide the eye, were sufficient.
I toyed with having individual scales for each of the charts, so the max value for each chart equaled the same width (less of a deconstructed stacked bar and more just individual bar charts), but even though I didn't think comparing burgers to taxis was that significant, it didn't sit right with me, so maintained a consistent scale across all the bars.
I decided to round all values to whole dollars. Sure, there's some precision lost (and the totals don't always add up exactly now), but I felt it made for a much more readable, cleaner graphic. Five separate axis scales would look horrendous and hardly be readable (esp. for Big Mac), so I added label values for each bar. Normally I tend to align labels like this inside or outside the right hand bar end, but for ease of creation (in Illustrator) I aligned them to the left end.
Gone are the flags and little graphics. I never see the reasoning behind including country flags in graphics like this. If someone doesn't know which country Prague is in, they are unlikely to recognise the country from the flag. Better to have the country name instead (or just have neither).
I stripped back the colour scheme to a simple blue and grey palette. To help indicate that the four charts on the right are a breakdown of the total chart, I used a lighter shade of blue.
Finally I improved upon the heading with an explicit statement based on the data. I thought a little about what I was trying to show with this dataset. Without having a full (or fuller) dataset for global cities, we can't say that 'Zurich is the most expensive city for nights out', but we can compare it to another city within the data - in this case Mexico City was the obvious choice.
The final graphic: